Since May of 2020, we have seen over 2000 articles per week published on COVID-19. That’s a lot of new information to absorb and digest. And of course, with COVID, we have not only the problem of too much information too quickly, but the urgency–especially back in Spring 2020–to find answers and experts now.
It was this context that provided CCC the impetus to take some experimental work we were doing in-house on data pipelines and build a COVID author graph. In April 2020 we released a prototype of a knowledge graph of authors who specialize in COVID and related fields of study. That prototype was the precursor to CCC Expert View.
Why did we do that? We believe that knowledge graphs, and their ability to quickly answer questions from large datasets of entities and relationships, are an appropriate tool for finding people and experts in a dataset like the COVID literature.
How We Built CCC Expert View
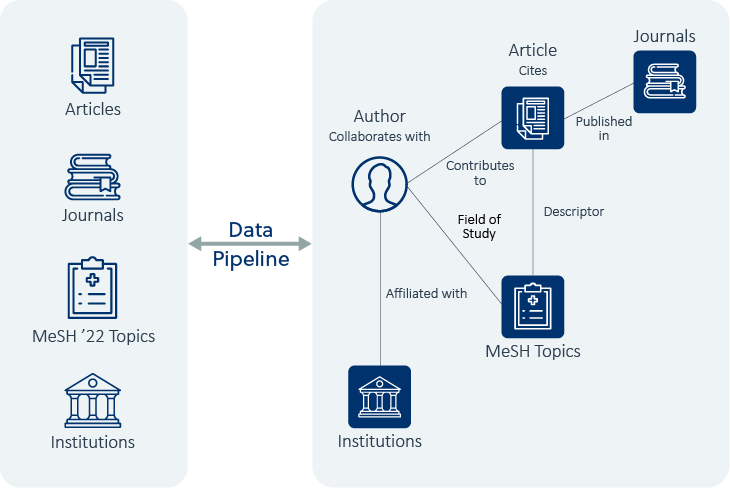
The knowledge graph is comprised of two key elements: a data pipeline that produces graph data from source data, and an application that allows the user to explore and interact with that data.
We start with article metadata and journal data, medical subject headings (MeSH) for our ontology, and institution data from Ringgold. The source data is standard XML and tabular data. As a source of information, it presents many of the challenges that we discuss in more detail here (no clear entities, voluminous, few explicit relationships, of unknown data quality).
Next, we take this data and run it through our data pipeline. This pipeline is a series of processing steps whose purpose is to extract the relevant entities and their relationships in the form of graph data. There are five types of entities, namely: authors, articles, institutions, journals, and fields of study. And there are many different types of relationships between them, such as connections between authors and authors, authors and articles, and authors to affiliated institutions.
What Happens at Each Stage of the Pipeline
Gather reference data
These are reference frames that are externally available. We bring in standard identifiers (NLMID, ISSN, MeSH, Ringgold identifiers). We are using known identifiers to build our reference framework. This is the non-article data.
Select Content
Next, we bring in our article data and select which content we want to process based on certain customer criteria. This is both selecting the appropriate metadata to use and filtering for the domain of interest.
Create Distinct Authors
Subsequently we create the list of distinct authors. This is the heart of the process where we determine which of the authors represented in article source data are actually distinct individuals and what variations of a name correspond to the same physical person.
Conduct Statistical Analysis
Next, we conduct a statistical analysis both for quality assurance purposes and to calculate our level confidence, or degree of belief.
Finally, we produce our final datasets.
The final graph that we produce is a product of a knowledge system; a term used to indicate that there is an iterative nature of refinement built into our processing of the data with the goal of obtaining knowledge. Our learning architecture sets the foundation for improving the quality of the data in the graph over time by quantifying each assertion and providing benchmarks of quality.
To keep learning, check out:
- “The Data Quality Imperative” from CTO Babis Marmanis. He discusses the impact data quality has on knowledge production, with examples from our experiences working with bibliographic raw metadata for the CCC COVID Author Graph.
Interested in knowing more about how CCC Expert View can help your organization identify experts and key opinion leaders? Learn more.


